


What is a Yield Curve and why is it so important?
In the world of finance and economics, yield curves play an important role in determining the health of the economy. It is a graphical representation of the interest rates on bonds for a range of maturities.
In simple terms, a yield curve represents the relationship between interest rates and the maturity dates of a set of fixed-income securities, mainly bonds. It indicates the difference in the interest rates between multiple maturities or the time-frame of a bond.
-
Why the Yield Curve is so Important?
- The yield curve is typically upward sloping reflecting higher interest rates for long-term investments compared to short-term ones.
- This dynamic is tied to the risks associated with long-term investments and the compensation investors demand for those risks.
- However, the yield curve may change shape at various stages depending on the economic conditions.
- The yield curve is highly interesting for investors to monitor as it can tell them if, recession is on the way. An economic indicator that predicts if, the economy is on the brink of getting sick.
- The US Yield curve is the one investors and economists pay most attention to as it influences global financial markets. It is used as a global economic barometer for investors to understand where the world’s largest economy is headed and indicates looming economic downturns.
-
Let’s Understand the Different Types of Yield Curves
-
Normal
The normal yield curve is upward sloping.

A normal yield curve represents higher interest rates on long-term investments like 30-year bonds than short-term investments like 10-year bonds.
Normal yield curve reflects a healthy and expanding economy. It indicates the economy is stable and robust. It often serves as a benchmark for setting lending rates for various loans.
A normal yield curve also reflects expectations of higher inflation and interest rates that come with a healthy economy.
-
Flat
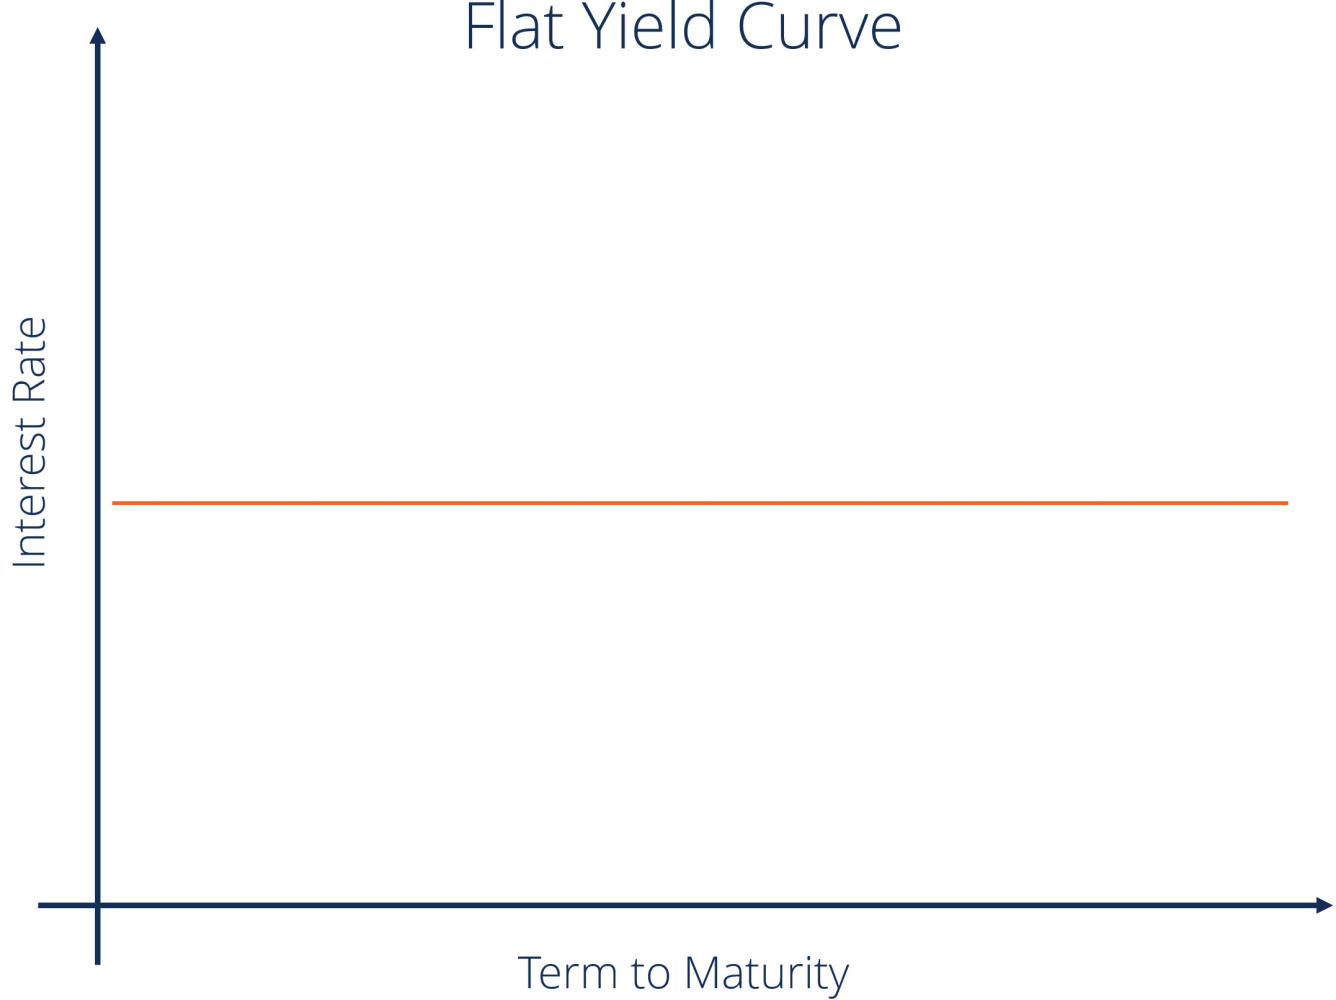
A flat yield curve represents little or no difference between the yields on short-term bonds and long-term bonds.
It’s like two people are eligible to receive similar interest on maturity of 10 years bonds as well as 20-year bonds.
A flattening yield curve may raise questions on the future direction of the economy.
-
Inverted

An inverted Yield curve reflects a downward slope. It is when yields on short-term bonds are higher than yields on long-term bonds. Historically, inverted curve indicates signs of recession. An economic downturn which compels investors to settle for short-term yields.
A rare scenario, but it strongly signifies the well- being of the economy suggesting a possible economic crisis on the cards.
However, it is important to note that a negative yield curve does not always guarantee a recession, economists use it as a warning sign because historical data shows that whenever the yield curve has entered a negative territory in the past, it's often been followed by a significant fall in the market.
The timing of these events has varied, but the pattern has remained unchanged.
Yield curves are of mainly three types. Normal, Flat and Inverted.
How Long has it taken for an Economic Downturn to occur following an Inverted Yield Curve?
Ideally, on an average, it takes 590 odd days from the first inversion of the yield curve to the onset of recession.
This is the pattern observed from the data recorded since 1978. Currently, looking at the yield curve, there are high chances we are close to it.
Also, while people argue that an inverted yield curve is not an accurate indicator of economic downturns, but the data stated below shows a different picture.
This table includes the number of days it took for a recession to occur following the first inversion of the yield curve for 2-year and 10-year bonds.
-
Days from First Inversion to the Onset of Recession:
- Aug 1978 – 820 Days
- Jan 1989 – 575 Days
- Jan 2000 – 485 Days
- Jan 2006 – 910 Days
- Sep 2019 – 190 Days
- July 2022 – 475 Days (at present)
-
How deeply the Yield Curve has Inverted and the Effects it
had on the Financial Markets:
- Aug 1978: Inversion: -2.28 | Market Fall: 28%
- Jan 1989: Inversion: -0.43 | Market Fall: 17%
- Jan 2000: Inversion: -0.52 | Market Fall: 47%
- Jan 2006: Inversion: -0.18 | Market Fall: 46%
- Sep 2019: Inversion: -0.08 | Market Fall: 33%
This time, we've observed the lowest inversion till -1.07, and based on the Price-to-Earnings (PE) and fair valuation of the S&P 500 (SPX), I am expecting a market fall around 40%.
-
Factors that indicate the probability of a Market Fall or
decline
-
Un-inverting of the Yield Curve
When the yield curve turns negative, usually, people expect a market fall to occur. However, that’s not the case always.
At times the yield curve may turn negative, but the market may or may not decline. Negative is seen as a sign that a recession might be on the horizon, but it's not a guarantee of an immediate market decline.
Here’s an important point to note that the market witnesses a real fall when the yield curve starts turning positive after being in the negative territory for a while.
An inverted yield curve can tell you that recession is near, but the actual market fall will start occurring only when the yield curve turns positive from negative. This will happen typically within a few weeks or months.
- Aug 1978: Un-inverted in April 1980, and the fall began in Dec 1980 (8months).
- Jan 1989: Un-inverted in March 1990, and the fall started in Jul 1990 (3months).
- Jan 2000: Un-inverted in Jan 2001, and the fall began in May 2001 (4months).
- Jan 2006: Un-inverted in July 2007, and the fall started in July 2008 (1 year).
- Sep 2019: Un-inverted in Oct 2019, and the fall began in Feb 2020 (4months).
- July 2022: Currently at -0.14.
I am expecting it to un-invert in the coming weeks, and an average of 6-7 months until the expected start of the fall.
Based on historical patterns, it's reasonable to expect that a recession may potentially hit around the end of the first quarter of 2024 or during the second quarter of 2024.
-
Increasing Jobless Claims and Unemployment Rates
- Jobless claims- 198k
- Unemployment Rates- 3.7%
At present, unemployment rates and jobless claims at their lowest levels.
However, if these numbers start increasing rapidly in the coming months, we may have to exercise caution.
My View:As per my analysis, I am expecting a rise in unemployment rates and jobless claims from January 2024.
As the number of corporate bankruptcies and corporate debts reported every month are increasing, to save on costs, companies will start laying off people. This may lead to an increase in the figures.
Market ReactionsRecently, the market began reacting after touching the high level of 4620 during the bullish rally of 2023. At present, it has seen a substantial drop to 4103 as per the closing price of last Friday.
My View:I think the market is oversold, like it has dropped a lot and will likely stay within a certain range, approximately between 4050 and 4420 points for a while.
The level of 4050-4100 is crucial and is the key support for SPX and if, the market falls below that, it could drop even further to 3600 points.
But I don't see that happening in the short term. Right now, the market is at a critical point, a make-or-break situation.
If it manages to go beyond 4420 points, it might reach to 4800 points, creating a perfect double top pattern as per technical analysis indicating a major trend reversal in the long-term trend of the past 20 years.
Understanding the market right now is challenging as factors like market news and market emotions are influencing it leading it to trade in a specific range bound.
For investors, it is crucial to pay close attention to the yield curve, economic signals, and new trends to make conscious investment decisions. The world of finance is always changing with new challenges making it tricky to decipher.